Tag Archives: data

Write Out and Data

I spent the morning with writing project colleagues–writing, reading, thinking, and talking. It was the first of our virtual study groups. Participants chose from one of three books: Tell Your Story, Writer to Writer, and Cultures of Thinking in Action. We started the morning as a whole group, writing our way into the day and then moving into breakout groups to share our writing and to connect with our colleagues. Each of our three meetings will also offer a “taste” of one of the books. This morning, it was Writer to Writer. We learned about Exploration Boards (in workshop 4). One of my take-aways was that data could work as a writing prompt.

I keep thinking about the ocean and all the devastating impacts our current climate crisis is wreaking. The warm waters that I love are devastating our kelp forests and the ecosystem they provide for numerous species. The awe-inspiring sightings of orcas off our coast are the result of ocean changes that are disrupting food chains and contributing to starvation events for sea birds.

We often think about storms as the cause of flood events, but along the coastline tidal changes can cause huge amounts of devastation. An instagram reel I watched this morning was a vivid reminder of the havoc high tides can cause. I love a low tide–and we have some low ones coming this week that will provide an amazing walking beach and maybe even some tide pooling opportunities.
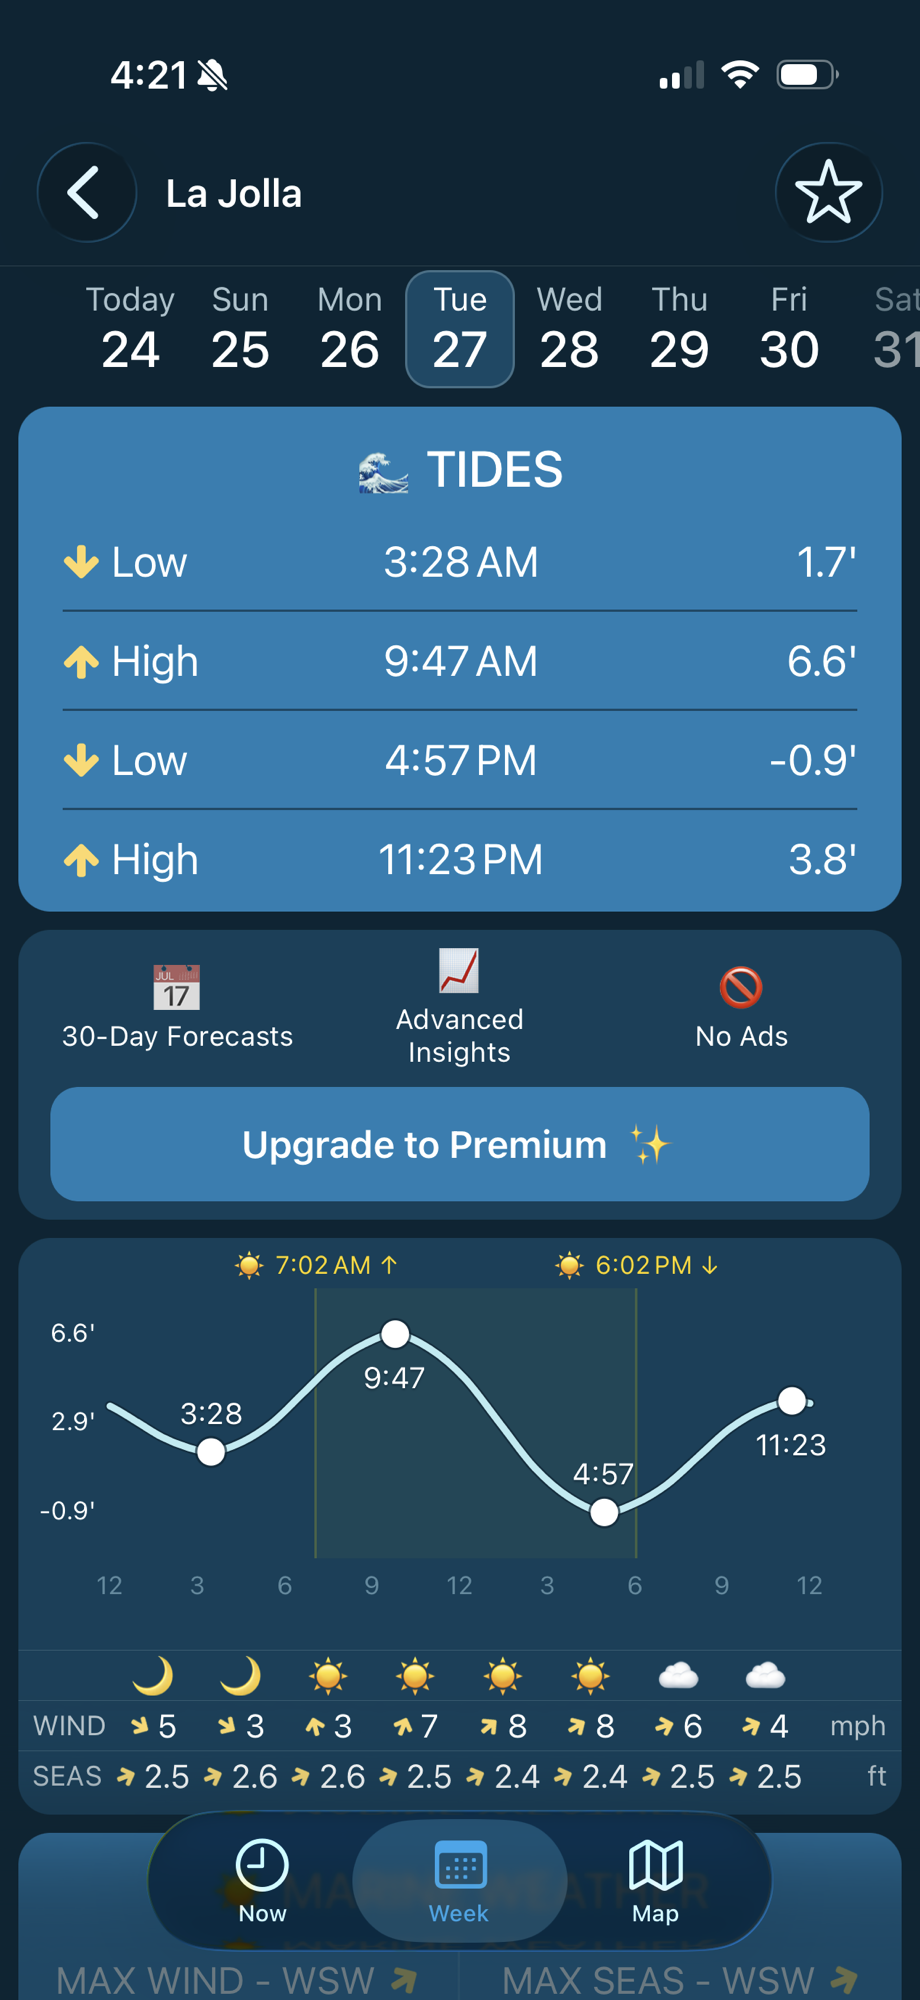
But those low tides also mean very high tides. It means that the trains that run along the coast will not be running for fear of the wave activity impacting the railroad tracks. It means coastal flooding of roads, dangers to homes, and potential cliff collapses.

When I open my weather app, I see a coastal flood warning right below the temperature. Combined with this graph from my tide app, I can see that very high tides are the reason. How often do we use charts and graphs of data to help us understand information? How often do we offer this kind of data to students? How can making sense of data also become a writing prompt? What kind of data is relevant to your place and can help those who live there take action?

My beautiful walk on the low tide beach today also became a time for thinking about data and fueled my writing about the (literal) ups and downs of the ocean.

It was a gorgeous day on the beach, in spite of my ongoing worries about our coastal environment.

Thinking about Data: SOLC #18

Have you ever had the experience where you read a post on social media and it sends you down a rabbit hole of further exploration, thinking, and wanting to tell everyone you come across about what you found?

Laurie over at the San Marcos Writing Project Facebook page does an amazing job of posting current blog posts and articles related to education, writing, and connections among and beyond. It’s like an article-at-a-glance from so many different sources. I’m not really sure how she does it, but I totally appreciate her curation of relevant information. Every once in a while, one of the articles shared catches my attention and I find myself going into a deep, satisfying swan dive.

The title, The Trouble with Data, immediately got my attention today. In the piece, the blogger talks about data related to the COVID pandemic–the lack of it, the problems with it–based on a science article in the Atlantic–and then extrapolates it to education.

The three points, in both the Atlantic article and in the blog post, resonated with me and my own experiences with folks who value data (meaning numbers) over all other ways of knowing. The argument these data people always want to make is that data is objective, other ways of knowing are subjective. (Meaning, objective=good, subjective=bad)

Now, please be assured, I am not anti-data or anti-science. I simply always want to know where the numbers came from, how they are gathered, who made the decisions, and about decisions made about how they are displayed and explained. I’ve spent plenty of time in conversations with colleagues explaining that in these seemingly objective testing scenarios, the subjectivity can be found in the decisions made prior to giving the test–in the development of content, format, who is tested, etc.

The three points that I keep thinking about are:

1. All data are created; data never simply exist


2. Data are a photograph, not a window.


3. Data are just another type of information.

When I think about the ways testing data is used to describe our students, the ways it constrains teaching and learning with a huge emphasis on test prep and tremendous time spent away from teaching and learning that is instead spent on the testing process, and the ways what teachers and families know about students is diminished as irrelevant compared to those “snapshots,” I keep going back to my questions about where the data comes from. I encourage you to read and think about data and the ways it is presented–often without context, background, and transparency.

And one more tidbit–this one about some “learning loss” numbers being thrown out into our educational mix. Check out this article from Forbes about where the number–57 days of learning lost during the pandemic–came from.

A quote shared in the Atlantic article to chew on:

Data-driven thinking isn’t necessarily more accurate than other forms of reasoning, and if you do not understand how data are made, their seams and scars, they might even be more likely to mislead you.

My mind is swirling with so many thoughts. I might need a conversation group to talk through some of this!