I spent the morning with writing project colleagues–writing, reading, thinking, and talking. It was the first of our virtual study groups. Participants chose from one of three books: Tell Your Story, Writer to Writer, and Cultures of Thinking in Action. We started the morning as a whole group, writing our way into the day and then moving into breakout groups to share our writing and to connect with our colleagues. Each of our three meetings will also offer a “taste” of one of the books. This morning, it was Writer to Writer. We learned about Exploration Boards (in workshop 4). One of my take-aways was that data could work as a writing prompt.
I keep thinking about the ocean and all the devastating impacts our current climate crisis is wreaking. The warm waters that I love are devastating our kelp forests and the ecosystem they provide for numerous species. The awe-inspiring sightings of orcas off our coast are the result of ocean changes that are disrupting food chains and contributing to starvation events for sea birds.
We often think about storms as the cause of flood events, but along the coastline tidal changes can cause huge amounts of devastation. An instagram reel I watched this morning was a vivid reminder of the havoc high tides can cause. I love a low tide–and we have some low ones coming this week that will provide an amazing walking beach and maybe even some tide pooling opportunities.
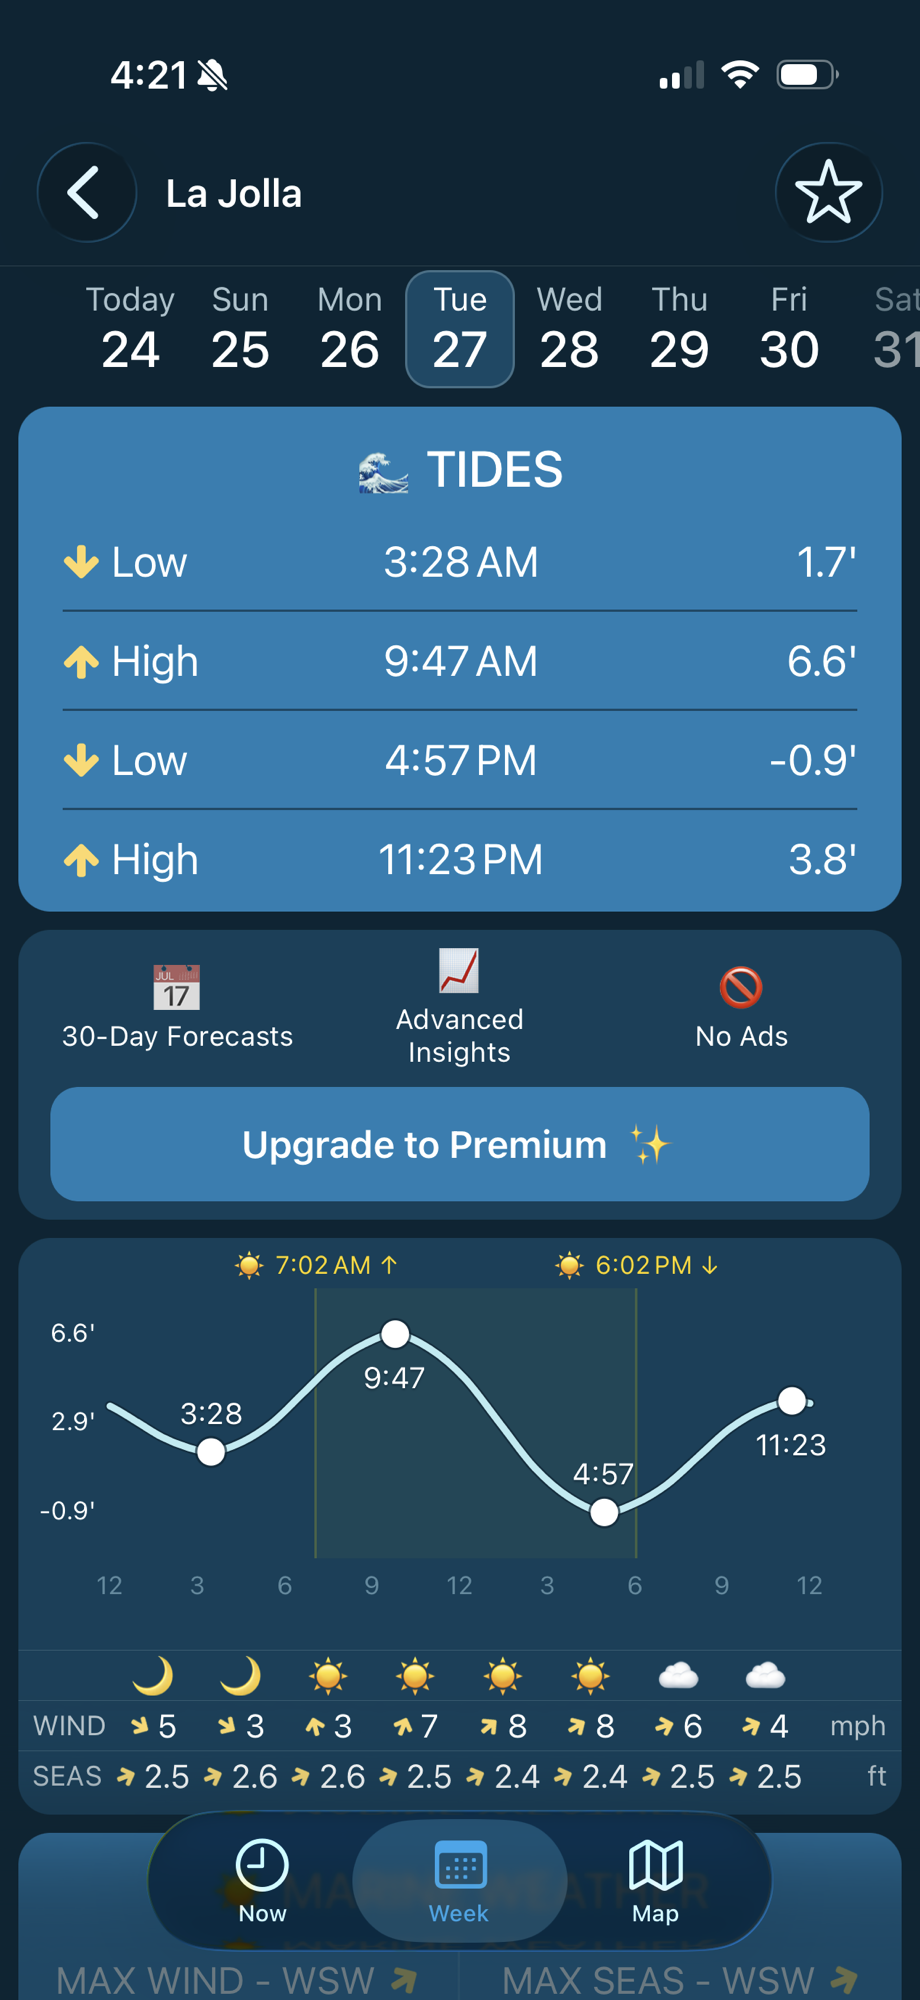
But those low tides also mean very high tides. It means that the trains that run along the coast will not be running for fear of the wave activity impacting the railroad tracks. It means coastal flooding of roads, dangers to homes, and potential cliff collapses.
When I open my weather app, I see a coastal flood warning right below the temperature. Combined with this graph from my tide app, I can see that very high tides are the reason. How often do we use charts and graphs of data to help us understand information? How often do we offer this kind of data to students? How can making sense of data also become a writing prompt? What kind of data is relevant to your place and can help those who live there take action?
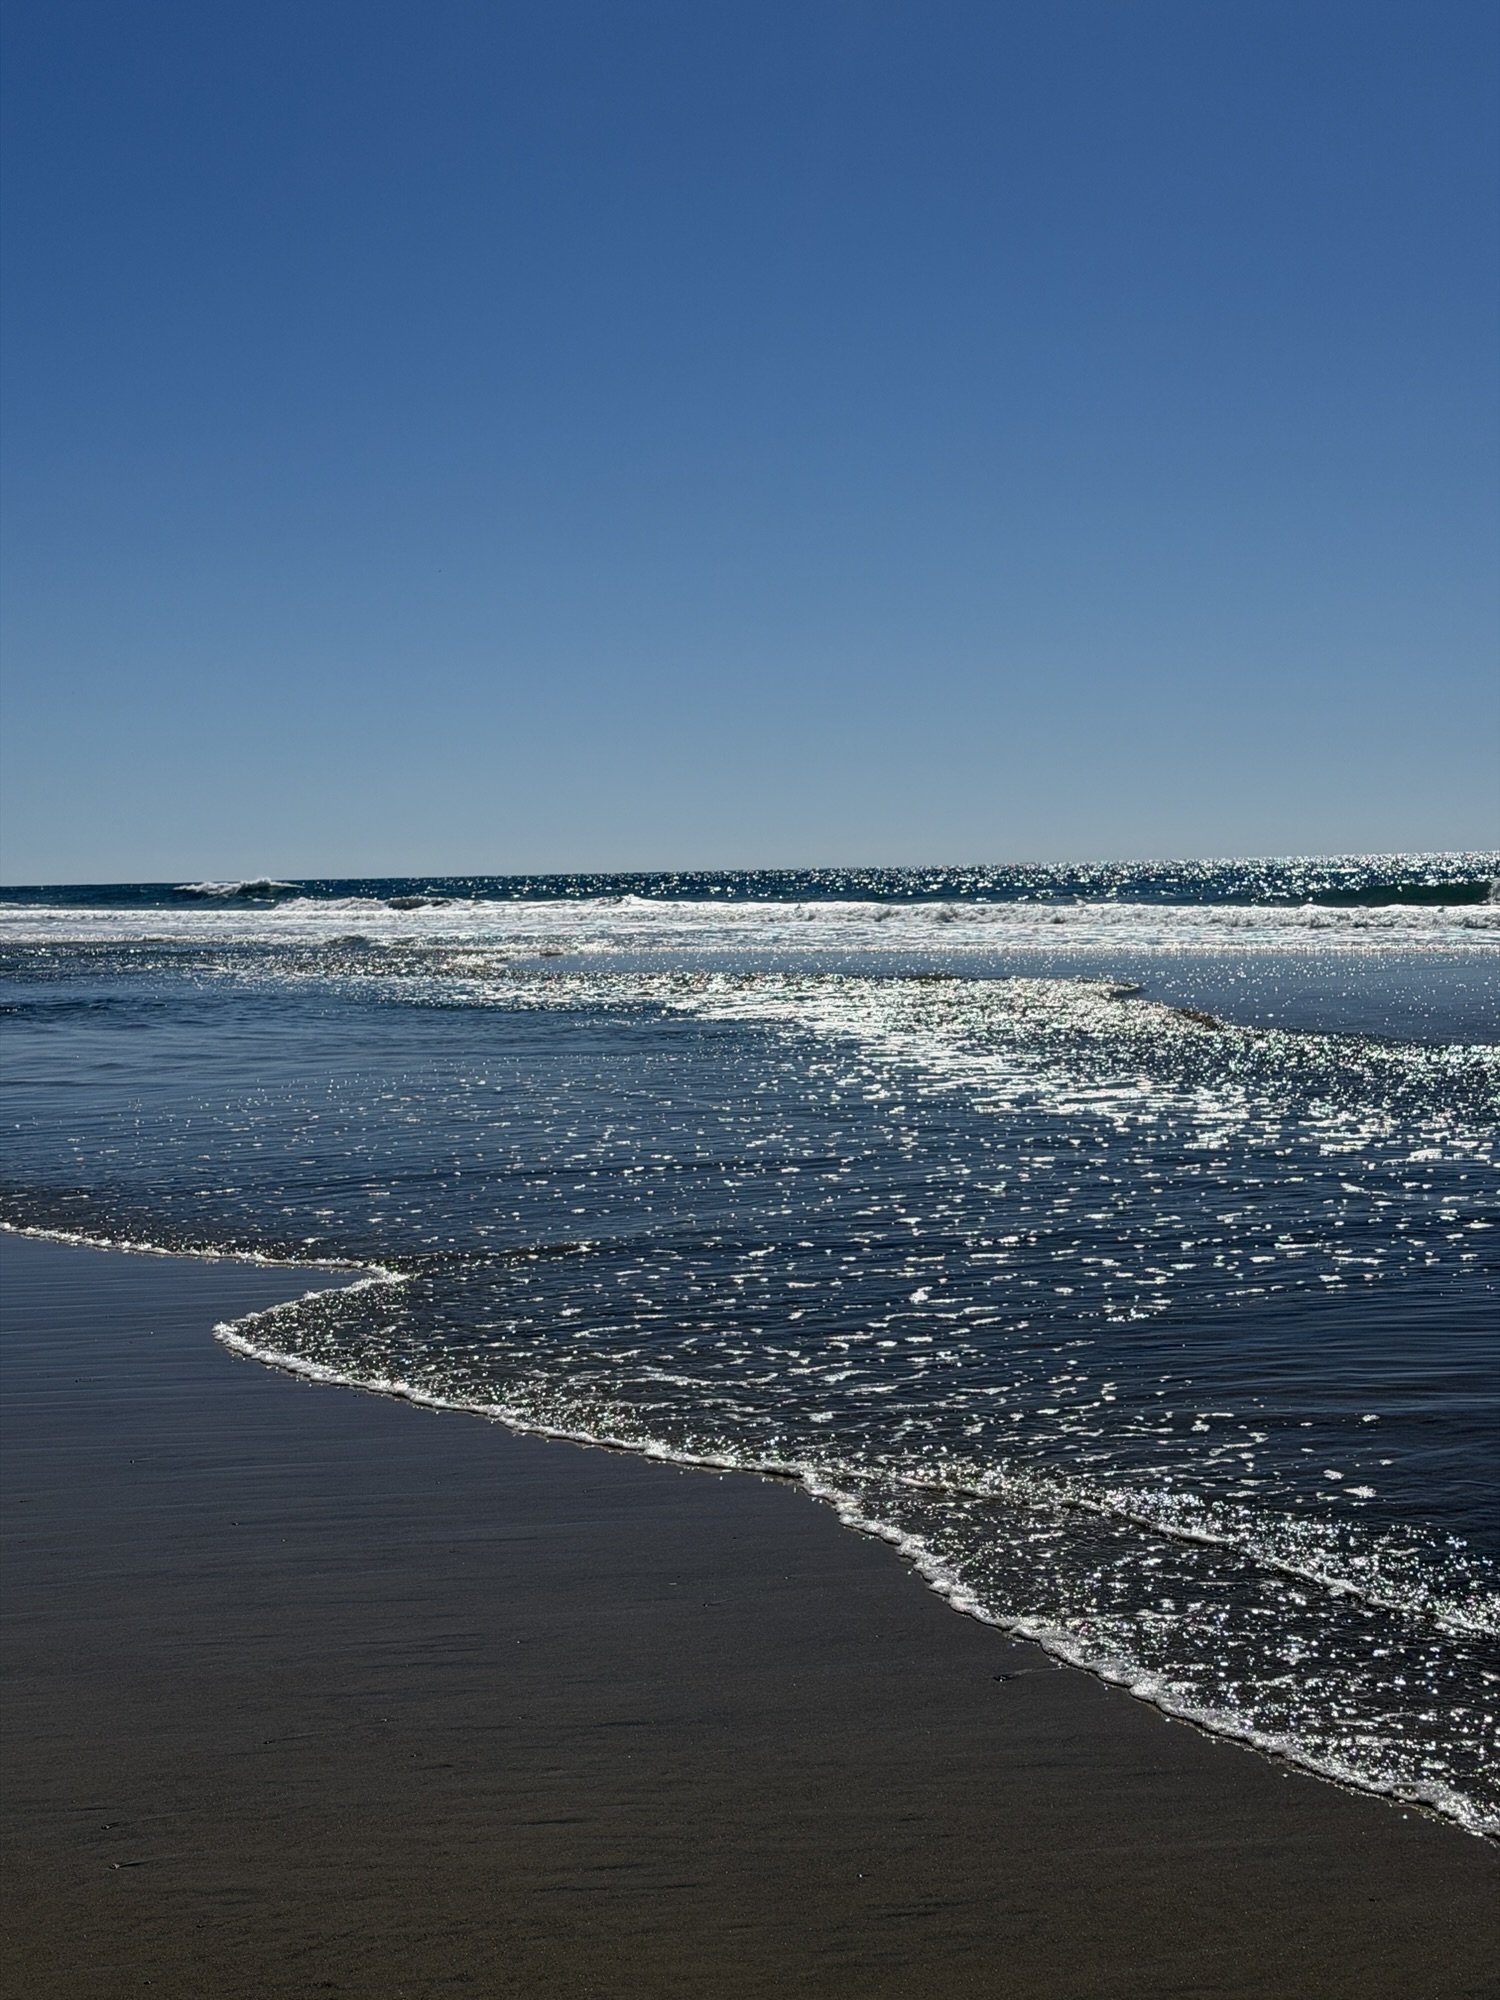
My beautiful walk on the low tide beach today also became a time for thinking about data and fueled my writing about the (literal) ups and downs of the ocean.
It was a gorgeous day on the beach, in spite of my ongoing worries about our coastal environment.